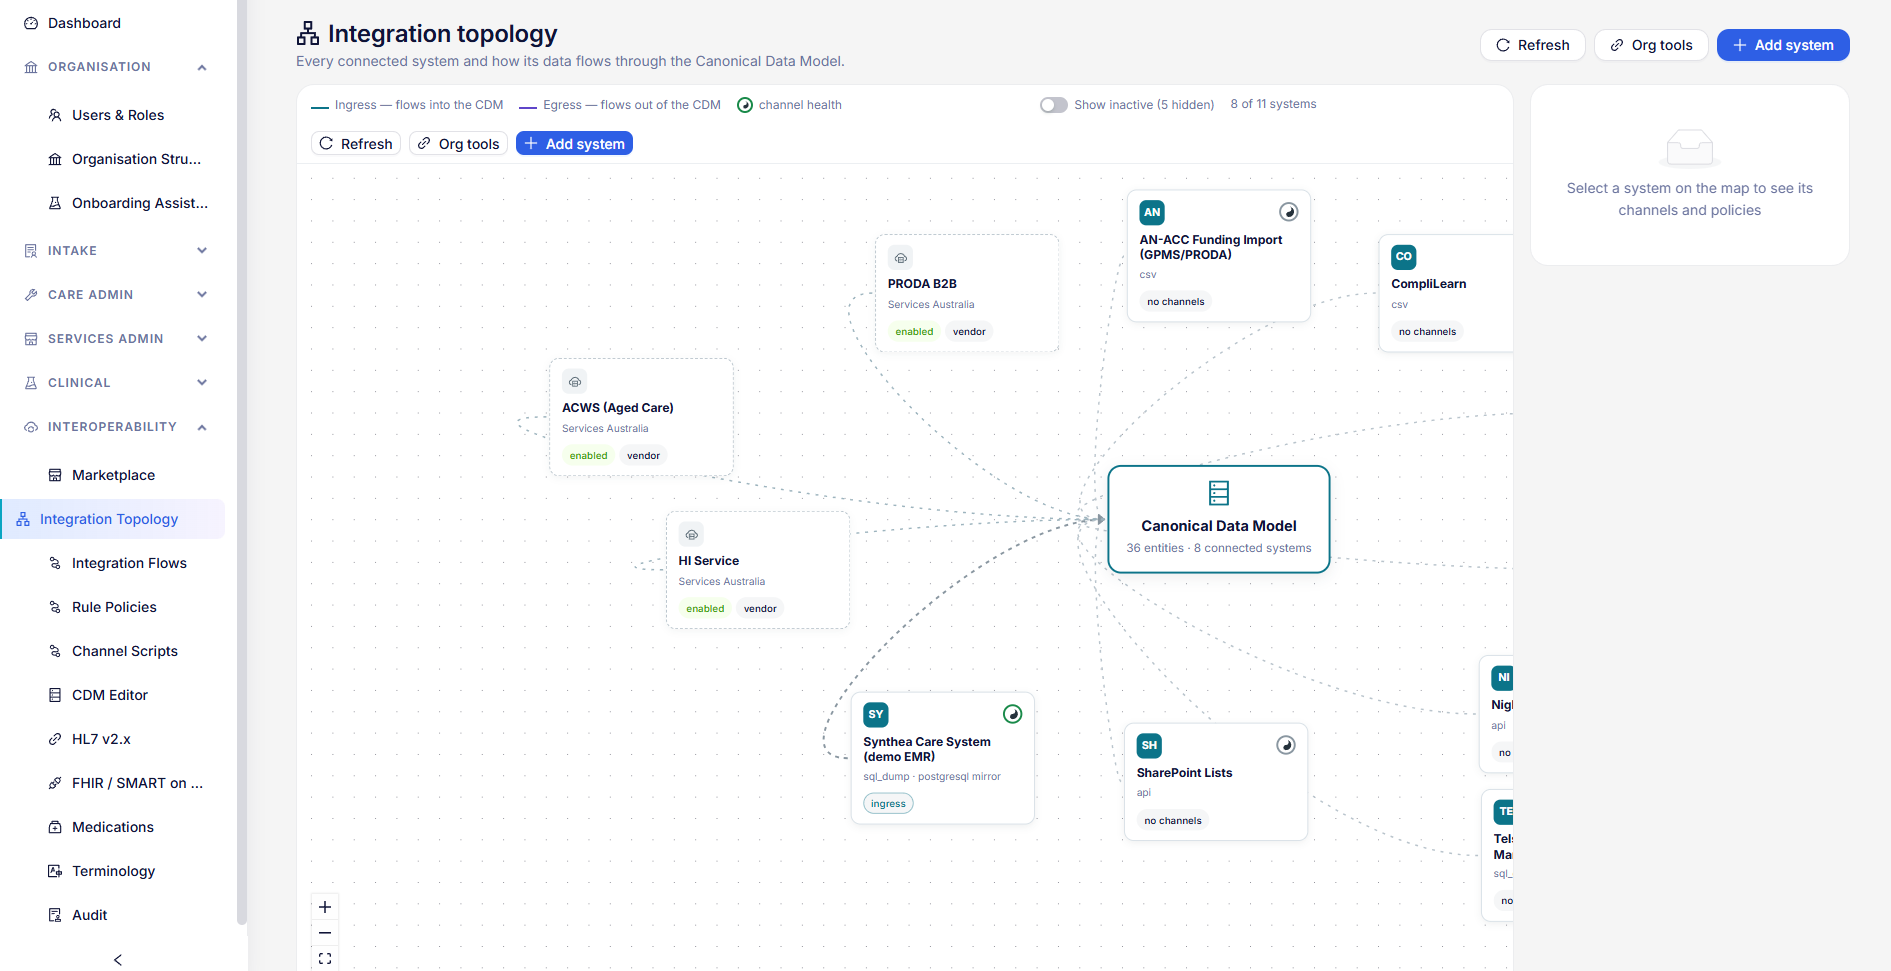
Live answers from the care record
Questions get answered from live care data instead of last month's extract, so the month-old board pack can go. Every event is captured, aligned to FHIR R4 / AU Core and kept with a seven-year audit trail.
Funding stream analytics.
Quality Indicator reporting and star ratings.
Plan utilisation tracking.
Referral pipeline metrics.
Data you can trust, ready when you ask
Every event captured
Every intake, assessment, service order and clinical entry is captured as an event, so nothing is lost. Every record change is kept with the user, the timestamp and the before and after values. The audit trail is immutable, queryable and kept for seven years.
- Real-time event capture
- Seven-year audit trail of every change
- Standard CSV, JSON and FHIR R4 exports that connect to your existing reporting tools without custom ETL
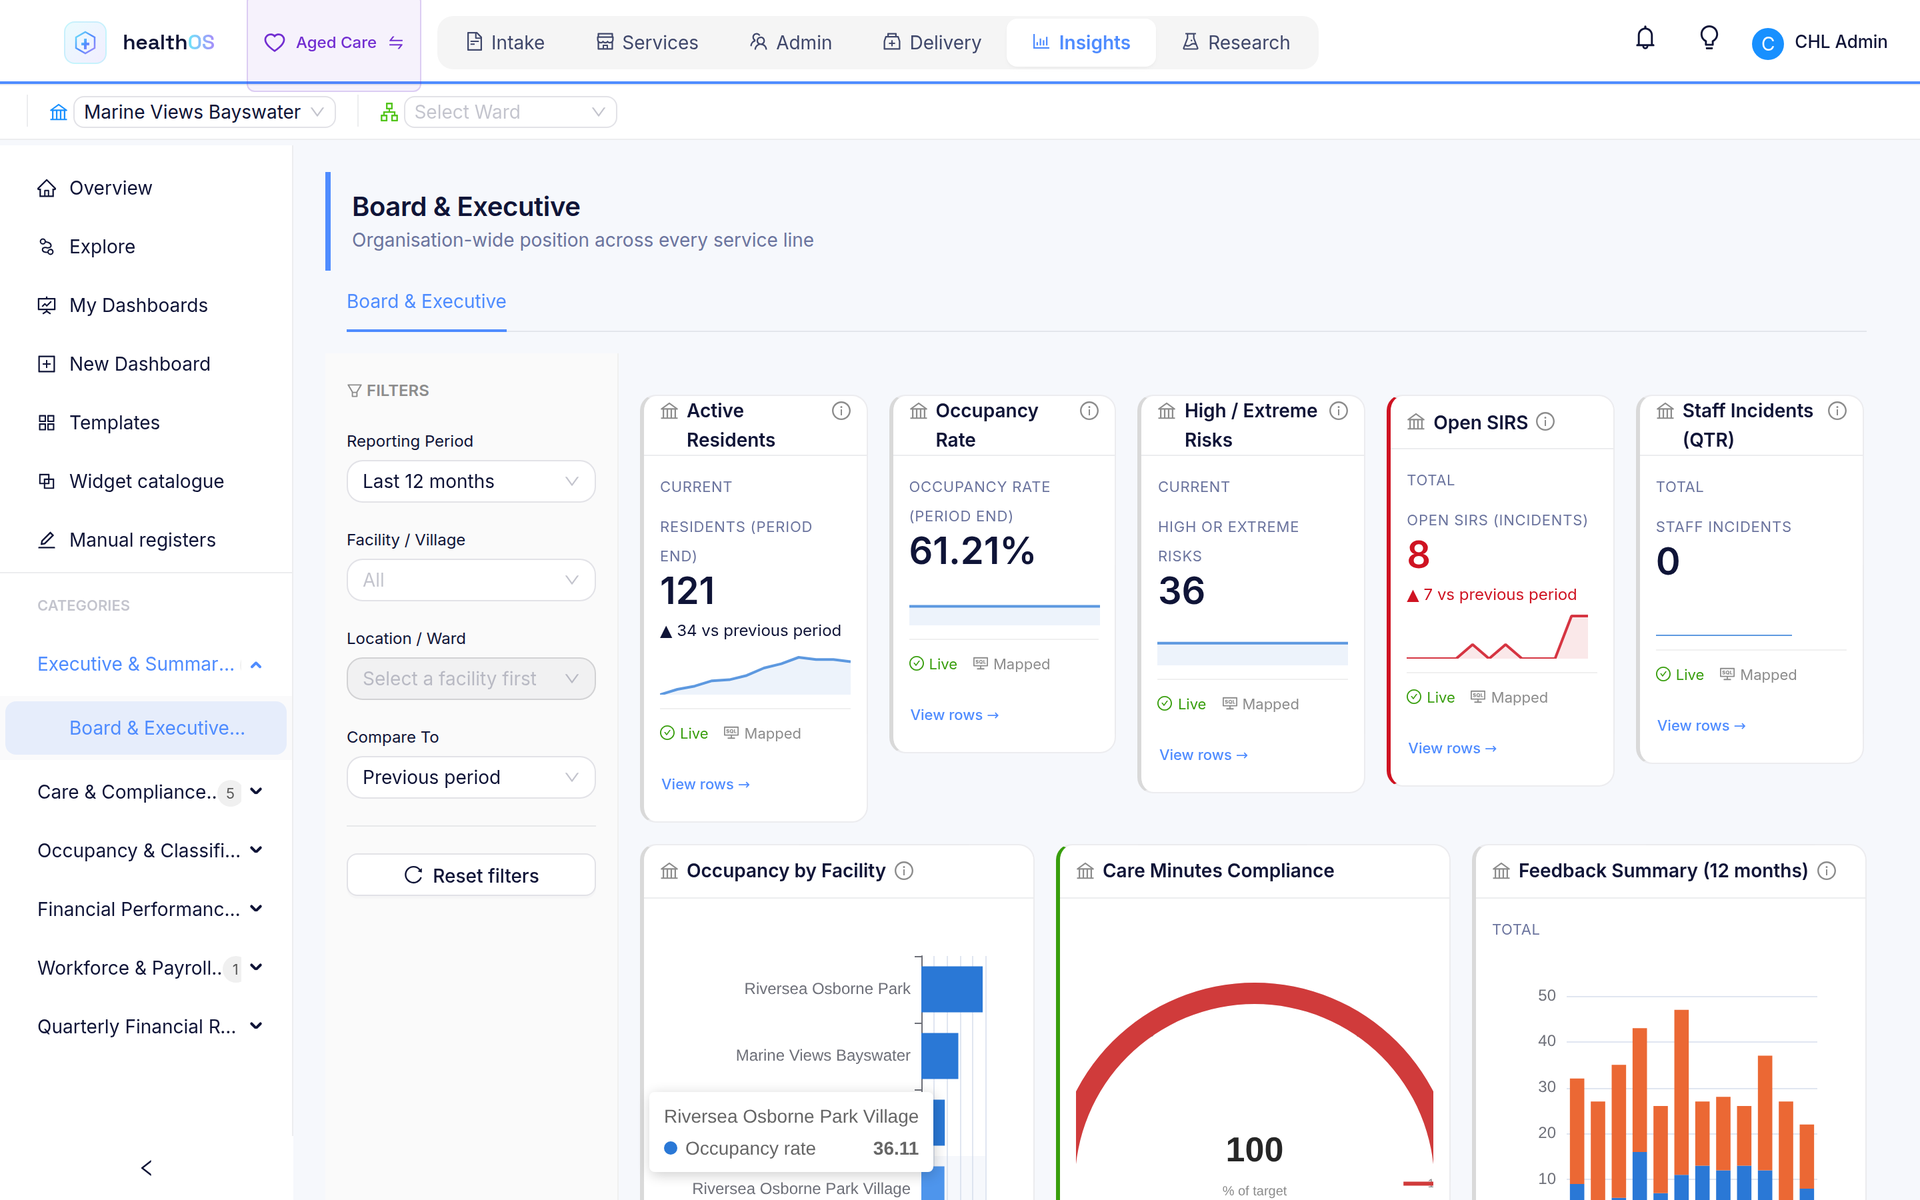
Operational insights at a glance
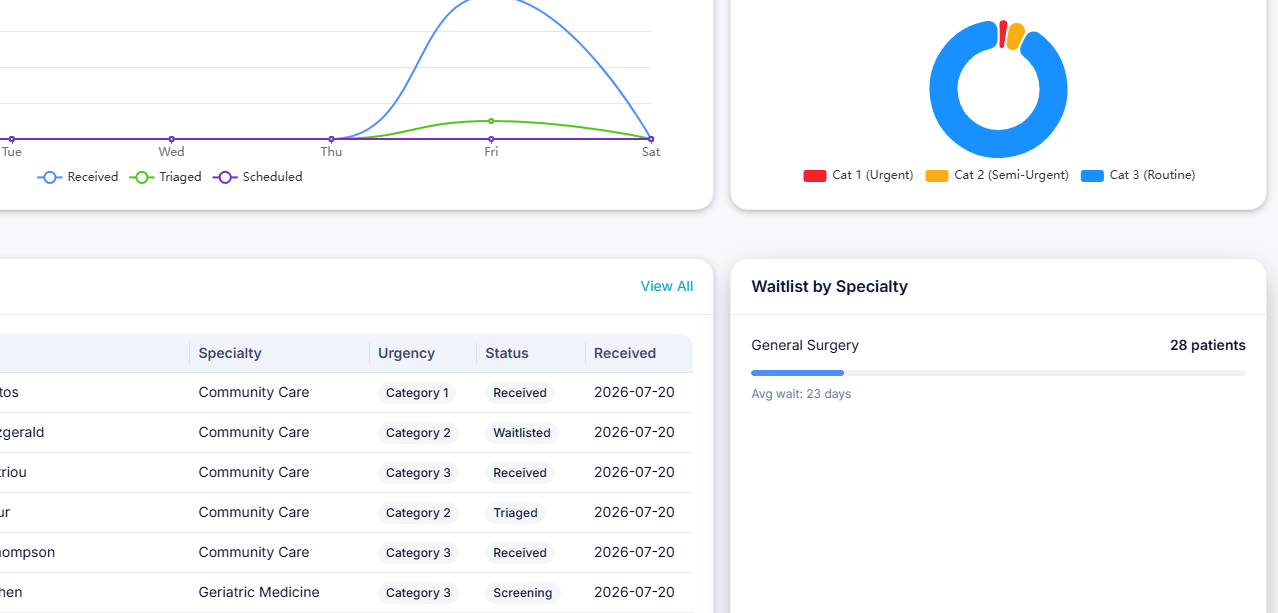
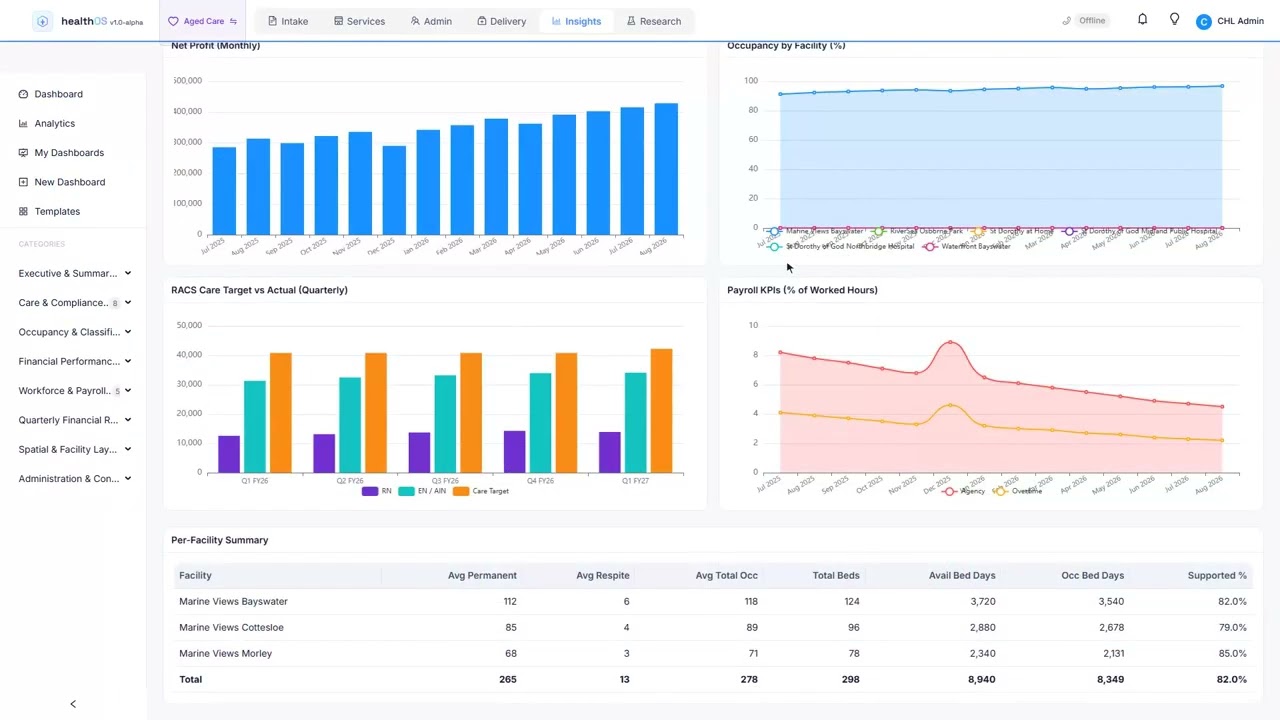
Built-in, real-time dashboards show what matters across every facility: the intake pipeline, service delivery, waitlist metrics and compliance reporting.
Ask in plain English
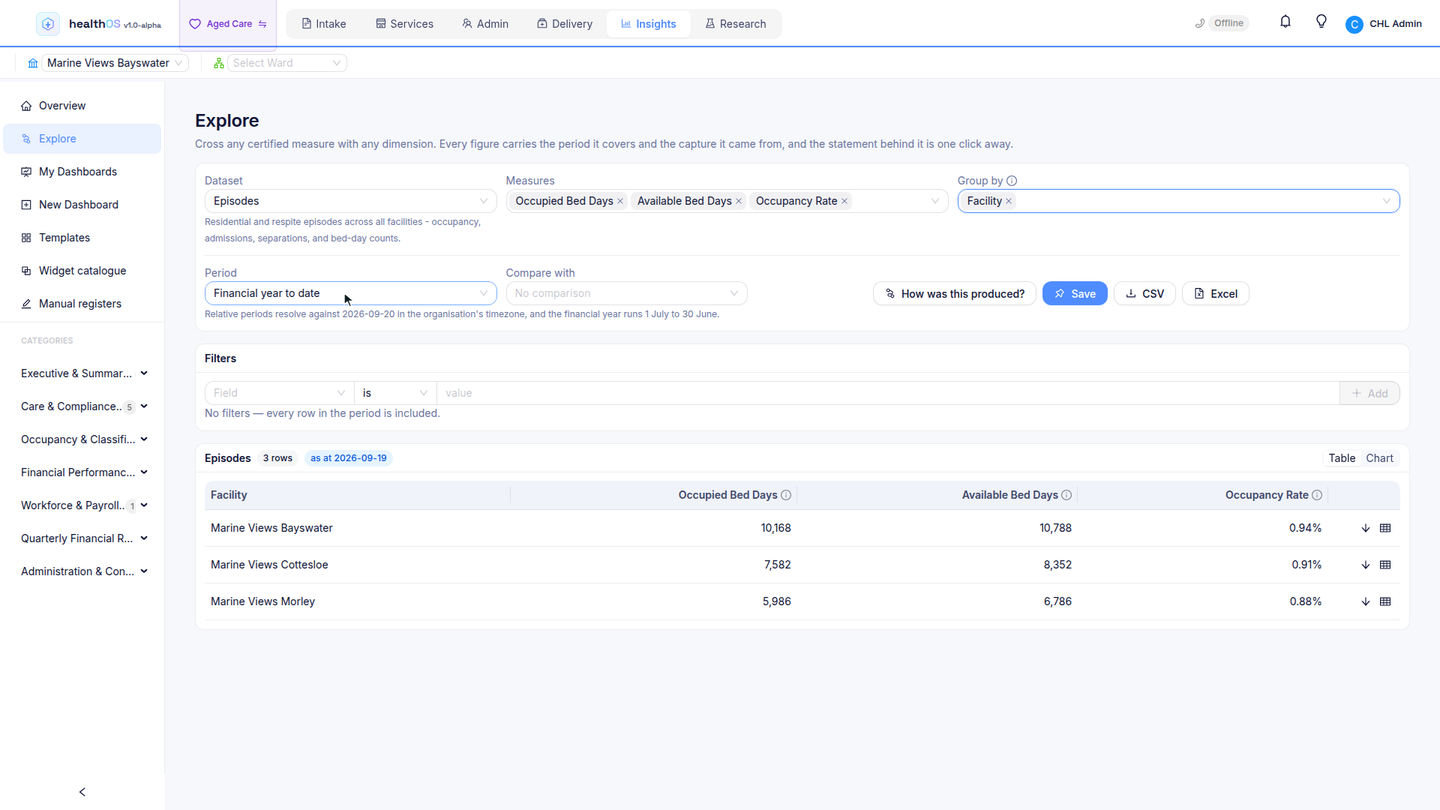
Anyone can ask a question about their data in natural language, whether they are an executive, a clinical lead or a compliance officer. Ask "show me falls by facility this quarter" or "which residents have declining weight trends", and HealthOS finds the right pre-built metric and narrates the answer. There's no SQL to write, no BI tool to learn and no wait for the data team.
- Natural language mapped to a pre-built metric, such as "show me readmission rates by ward"
- Fact rollups: pre-aggregated summaries for executive dashboards
Threshold alerts and derived metrics
Set a threshold on any pre-built metric, for example occupancy below 85%, falls above 3 per month or weight loss above 5%. A breach raises a notification. Combine two measures with arithmetic operators to create derived KPIs, tracked alongside the native measures.
FHIR R4 / AU Core from the ground up
The data model was aligned to FHIR R4 from the start and conforms with the AU Core profiles. Patient, Encounter, Observation, ServiceRequest and Claim are standard resources with standard exchange.
- FHIR R4 / AU Core resource alignment
- Standard API endpoints
- Bulk data export
- Ready for interoperability
A star schema data warehouse, built in
An analytics-grade data warehouse sits alongside the operational FHIR store. Dimension tables for facilities, wards, patient types, providers and funding accounts sit beside fact tables built for care sector reporting. The warehouse ships with curated views that answer the questions executives ask, so you don't wait for a BI team to build a model.
- Census facts: daily bed and place occupancy across every facility
- Incident facts: falls, pressure injuries, medication errors and restraint events
- Financial facts: revenue, cost allocation and margin by service line
- Occupancy trend by facility, ward and room type
- Incident rates per 1,000 bed-days, with benchmarking
- Connect your own BI tool through standard SQL or FHIR bulk export
Claims, AN-ACC and quality in the warehouse
More facts and views are being added. These are not available yet.
- In build: claims facts (Medicare, DVA, NDIS and private billing)
- In build: AN-ACC facts (classification, care minutes and funding per resident)
- In build: quality facts (QI indicator scores, star ratings and compliance benchmarks)
- On the roadmap: claims reconciliation views (submitted, paid and rejected)
- On the roadmap: care minutes delivered against target for AN-ACC compliance
See it in action
 1:21
1:21The short version

Related
See the data platform in action
We'll walk you through it on real data. Bring your questions.